
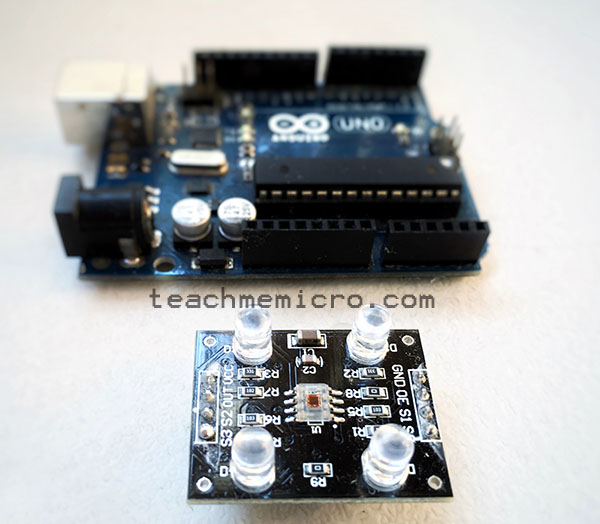
Last time, I showed how easy it is to detect colors using the Pixy2 camera. However, the camera’s price might be too expensive for some. Luckily, there is a much cheaper option to implement an Arduino color sensor.
The color sensor I’m referring to is the TCS230 (and equivalent TCS3200) from TAOS (now AMS). Now, this is a very common sensor and there are a lot of tutorials on how to use it out there. However, most of the example codes have some issues, particularly in pointing out the correct color. This article hopefully aims to arrive at an optimal working color sensor.
The TCS230 Color Sensor
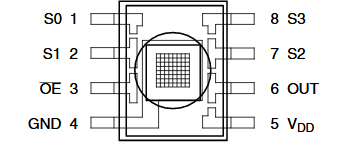
The TCS230 is a programmable light-to-frequency converter. Its output is a 50% duty-cycle square wave whose frequency is proportional to light intensity. Here is its pinout diagram:
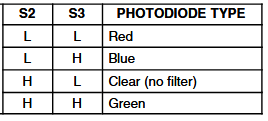
The IC becomes more sensitive to specific colors trough filtering. The TCS230 has 64 photodiodes, each grouped into 16 by color filters. This means there are 16 red-filter diodes, 16 greens, 16 blues and 16 diodes without filters. The user can choose which filter to use through the S2 and S3 pins:
The user can also choose to scale down (reduce) the output frequency through the S0 and S1 pins:
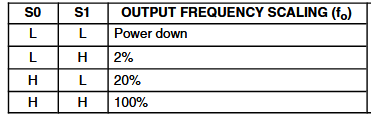
Scaling down the output frequency is helpful if there's difficulty in reading high frequencies but at reduced accuracy.
The output frequency of the sensor varies according to color:
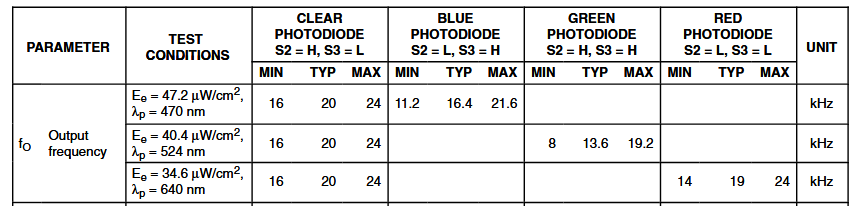
It says that when the sensor detects a color blue, its output frequency is between 11.2 kHz to 21.6 kHz. If it detects a color green, the output is between 8 kHz to 19.2 kHz. Finally, a color red is equivalent to a frequency between 14 kHz to 24 kHz.
Note that the values on the table above is for 100% scaling. If 20% scaling is used, for example, the frequency output for the color red becomes 2800 to 4800 kHz.
More information about the TCS230 is on its datasheet.
Reading Frequency with Arduino
In other example sketches, reading the frequency of the square wave is through the pulseIn() function. This function returns the width of the pulse in microseconds:
width = pulseIn(pin, HIGH);Here, the function measures a high pulse on the indicated pin.
However, I’ve always noticed reading errors with this function. With due diligence I found out how it is implemented:
unsigned long pulseIn(uint8_t pin, uint8_t state, unsigned long timeout)
{
   // cache the port and bit of the pin in order to speed up the
   // pulse width measuring loop and achieve finer resolution.  calling
   // digitalRead() instead yields much coarser resolution.

   uint8_t bit = digitalPinToBitMask(pin);
   uint8_t port = digitalPinToPort(pin);
   uint8_t stateMask = (state ? bit : 0);

   // convert the timeout from microseconds to a number of times through
   // the initial loop; it takes approximately 16 clock cycles per iteration
   unsigned long maxloops = microsecondsToClockCycles(timeout)/16;
   unsigned long width = countPulseASM(portInputRegister(port), bit, stateMask, maxloops);
   // prevent clockCyclesToMicroseconds to return bogus values if countPulseASM timed out
   if (width)
      return clockCyclesToMicroseconds(width * 16 + 16);
   else
      return 0;
}
In the code above, it seems that the pulse width is derived from multiplying the number of loops with the number 16 plus a value of 16 (to compensate for the first loop). The number 16 is the approximate number of clock cycles per loop. Since the value is an approximation, we expect inaccuracies in measuring pulse widths.
In fact, user TheDoctor acquired this data from an Arduino that is supposed to read 14 us pulses:
18,18,18,12,18,18,18,18,18,18,18,18,18,18,18,18,18,24,19,18,18,18,18,18,24,18,18,18,19,18,18,12,18,18,
19,18,18,18,18,18,18,18,18,18,18,18,19,18,19,24,18,18,18,18,18,18,18,24,18,18,18,18,18,18,18,18,18,18,
18,18,18,19,18,18,18,18,18,18,18,18,18,18,19,18,18,18,11,18
The mean of these values is 18.136. That’s a 4 us difference and for a 50% duty-cycle square wave, around 8 kHz of frequency difference. Now if you go back to the output frequency per color:
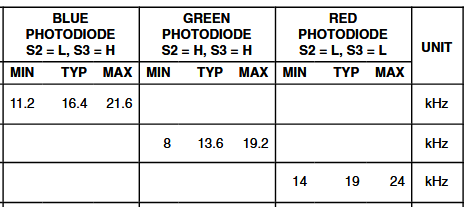
The colors are separated by only around 3 kHz. Thus, a 8 kHz difference is very significant!
Precision Frequency Counter
My Implementation
Thus, for a more accurate color sensor, we must build a more accurate frequency counter first. I can think of a couple or more ways to implement this particularly using interrupts.
For example, I could use the Pin Change interrupt libraryt then attach the output pin of the TCS230 to an ISR like this:
PCintPort::attachInterrupt(OUT, isr, CHANGE);To measure frequency, we need to determine the width of the pulse. For a 50% duty-cycle pulse, the high part is equal to the low part. Thus, the period of the pulse train is just twice the measured pulse. Frequency is then
Measuring pulse width is possible by checking the state of the input pin within the isr. If the pin is high, we note that as the start of the pulse. If the pin is low, that is now the end of the pulse. The pulse width is the difference between the time between the start of the pulse and the end of the pulse.
if(digitalRead(A0) == HIGH)
{
   startTime = micros();
}
else
{
   pulseWidth = micros() - startTime;
   frequency = 500000/pulseWidth;
}
The formula for frequency:
frequency = 500000/pulseWidth;
is from the fact that the measured pulse width is in microseconds and the period is twice the pulse width.
![]()
![]()
![]()
![]()
![]()
On the above sketch, I used micros() to determine the current time in microseconds. However, micros() increments by 4 us according to arduino.cc:
On 16 MHz Arduino boards (e.g. Duemilanove and Nano), this function has a resolution of four microseconds (i.e. the value returned is always a multiple of four). On 8 MHz Arduino boards (e.g. the LilyPad), this function has a resolution of eight microseconds.
Thus, the 4 us difference I showed before will still exist if I will use micros().
Using A Library
Thankfully, I found the FreqCount library that doesn't rely on micros() but pretty much works like how I presented. This is an example sketch from the library:
#include <FreqCount.h>
void setup() {
Serial.begin(57600);
FreqCount.begin(1000);
}
void loop() {
if (FreqCount.available()) {
unsigned long count = FreqCount.read();
Serial.println(count);
}
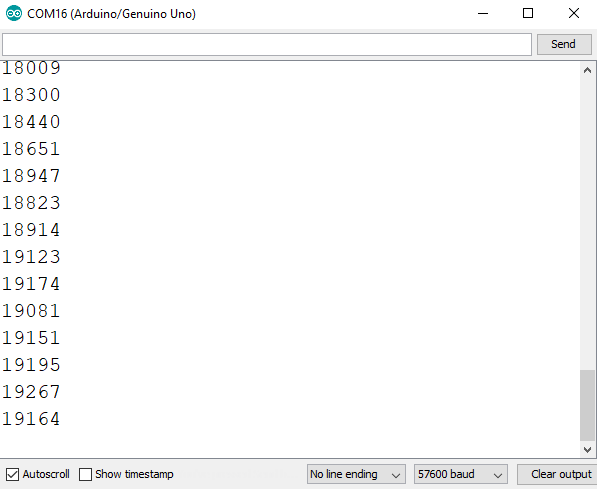
}The library works as expected as this was the output on the Serial monitor when I placed a red colored object in front of the TCS230 (with red filter on and 100% scaling).
This is the output with green filter and green object:
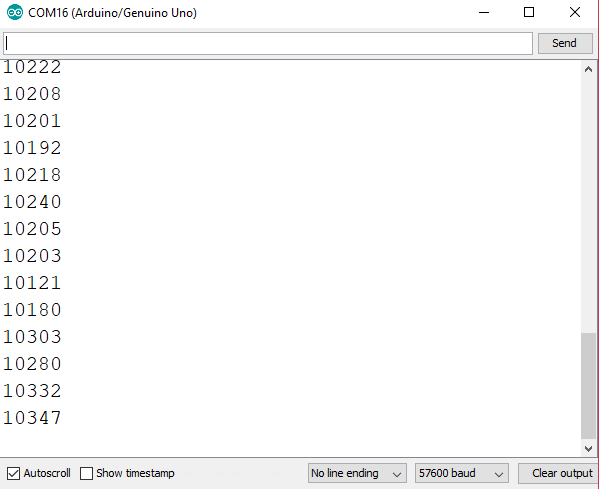
Finally, for a blue object with blue filter on:
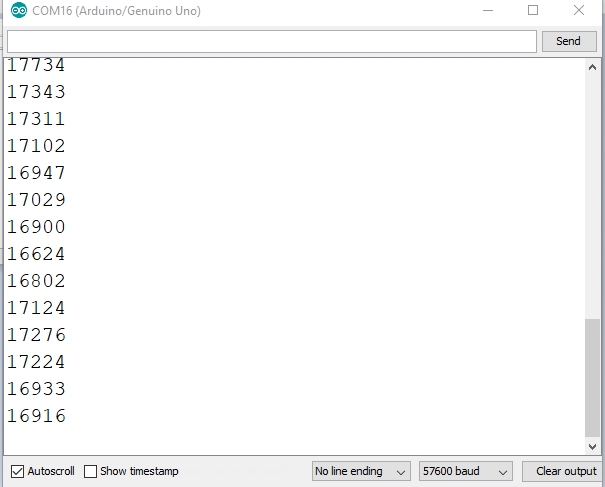
So far, the frequencies are within those indicated in the table above!
The limitation for the FreqCount library is that the signal input must be connected to digital pin 5 only. But hey, that's not bad considering its accuracy.
A Better Arduino Color Sensor
Now that we have a more accurate frequency counter, it’s time to build our Arduino color sensor. We will follow this wiring diagram:

We will be using 100% scaling so at setup(), we place:
digitalWrite(S0,HIGH);
digitalWrite(S1,HIGH);
Recall that S2 and S3 determine the color filter. For example, to activate the red filter, we use:
digitalWrite(S2,LOW);
digitalWrite(S3,LOW);
Then we read the frequency using :
if (FreqCount.available())
{
   frequency = FreqCount.read();
}
Then assign this frequency to the color:
red_freq = frequency;According to the datasheet, the expected frequency range for red is 14 to 24 kHz. Strong reds have lower frequency while weak reds have higher frequency. Since RGB color is in values between 0 and 255, this means the relationship between RGB and frequency is inversely proportional. Thus, we map this frequency range to 0 to 255 using:
red_value = map(red_freq, 24000, 14000, 0, 255);We repeat the same procedure for the colors green and blue.
digitalWrite(S2, HIGH);
digitalWrite(S3, HIGH);
if (FreqCount.available()){
 frequency = FreqCount.read();
}
green_freq = frequency;
green_color = map(green_freq, 19200,8000,0,255);

digitalWrite(S2, LOW);
digitalWrite(S3, HIGH);
if (FreqCount.available()){
 frequency = FreqCount.read();
}
blue_freq = frequency;
blue_color = map(blue_freq, 21600,11200,0,255);
Here is now the full Arduino color sensor sketch:
/* Arduino Color Sensor with TCS230 Module
by Roland Pelayo
using FreqCount library by Paul Stoffregen
for teachmemicro.com */
#include <FreqCount.h>

int S0 = 8;
int S1 = 9;
int S2 = 10;
int S3 = 11;
int OUT = 5;

unsigned long red_freq, green_freq, blue_freq;
unsigned byte red_color, green_color, blue_color;
unsigned long frequency;

void setup() {
  pinMode(S0, OUTPUT);
  pinMode(S1, OUTPUT);
  pinMode(S2, OUTPUT);
  pinMode(S3, OUTPUT);
  pinMode(OUT, INPUT_PULLUP);

  FreqCount.begin(1000);

  Serial.begin(9600);
  //100% Scaling
  digitalWrite(S0, HIGH);
  digitalWrite(S1, HIGH);
}

void loop() {
  //Turn on red filter
  digitalWrite(S2, LOW);
  digitalWrite(S3, LOW);

  if (FreqCount.available()){
     frequency = FreqCount.read();
  }

  red_freq = frequency;
  red_color = map(red_freq, 24000,14000,0,255);

  //Turn on green filter
  digitalWrite(S2, HIGH);
  digitalWrite(S3, HIGH);

  if (FreqCount.available()){
     frequency = FreqCount.read();
  }
  green_freq = frequency;
  green_color = map(green_freq, 19200,8000,0,255);

  //Turn on blue filter
  digitalWrite(S2, LOW);
  digitalWrite(S3, HIGH);

  if (FreqCount.available()){
     frequency = FreqCount.read();
  }
  blue_freq = frequency;
  blue_color = map(blue_freq, 26200,11200,0,255);

  //Show RGB values on serial monitor
  Serial.print("RGB: ");
  Serial.print(red_color);
  Serial.print(",");
  Serial.print(green_color);
  Serial.print(",");
  Serial.println(blue_color);
  delay(1000);
}
The RGB values of an object in front of the TCS230 is viewable on the Serial monitor.
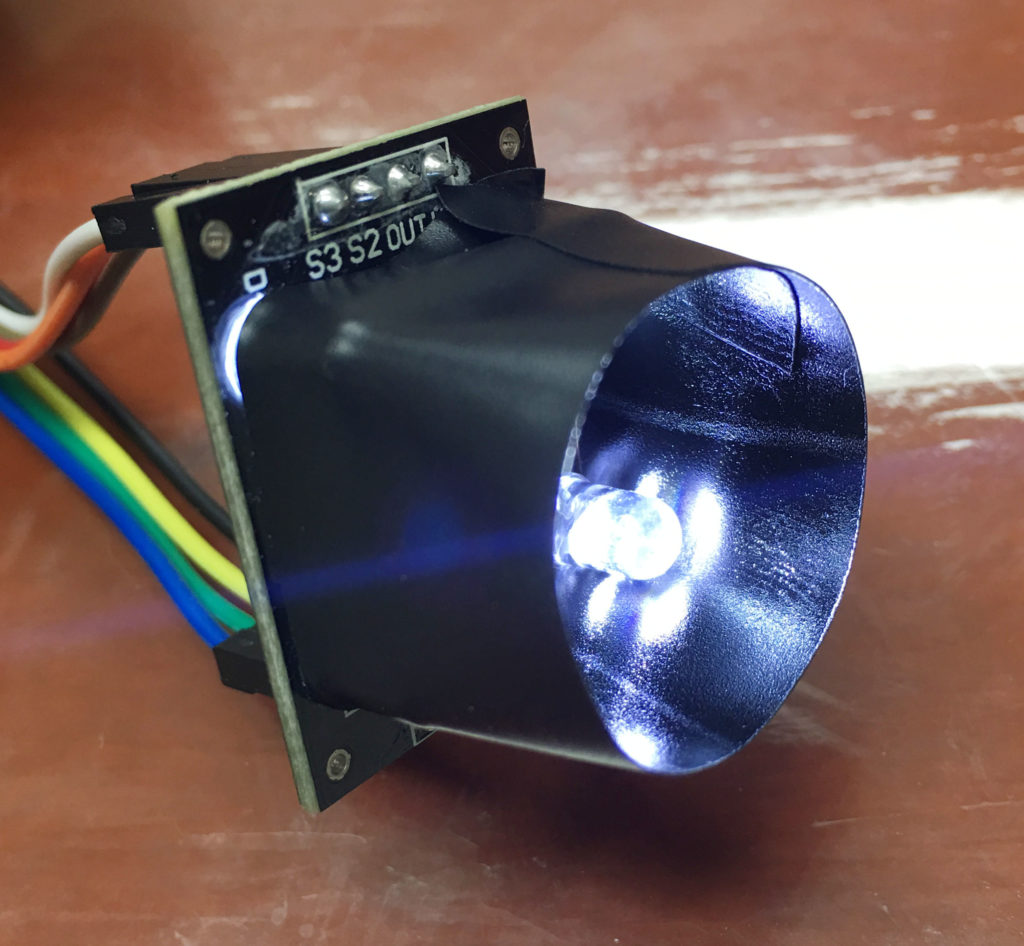
Now, the ambient light could possibly affect the output of the sensor. I recommend wrapping the module (including the LEDs) with a black material to lessen the effects of ambient light. Here's how my module looks like:
 Testing

Here's the output on the serial monitor when I placed a green object in front of the sensor:
You can pick the values seen on the Serial monitor and visit this site to confirm if its the correct color.
I have observed that shiny objects are easier to detect compared to non-shiny ones. This maybe because shiny objects easily reflect light and are picked up by the sensor easily.
Hopefully, I have arrived at a better sketch for an Arduino color sensor using TCS230. To the readers, please try it out and come back here and talk about your results. Happy building!