
In this tutorial, we will look into adding LED bar graphs to your Arduino projects. Understanding how to effectively use Arduino LED bar graphs opens up possibilities for visualizing data, creating dynamic displays, or simply adding an eye-catching element to your projects. Throughout this guide, I will show you how to get started, wiring configurations, and sample codes that help to seamlessly interface Arduino with LED bar graphs.
Introduction to LED Bar Graphs
LED bar graphs are essentially an array of LEDs in a more appealing package. They are primarily for battery or sound level indicators but can sometimes be found as displays for other analog sensors.
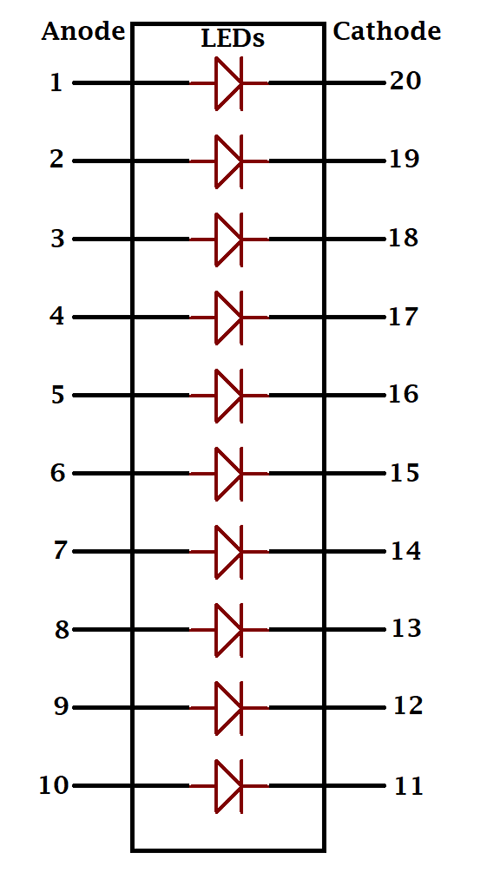
You can control an LED bar graph just like any other LED display. You just have to identify the cathode or anode side. Recall that the anode side is where you will apply a positive voltage while the cathode side is where you will connect to ground.
Some LED bar graphs have a dent on one edge to indicate that it’s the anode side. Some don’t have such a dent. For these types, you will need a multimeter to identify the anode or cathode side.

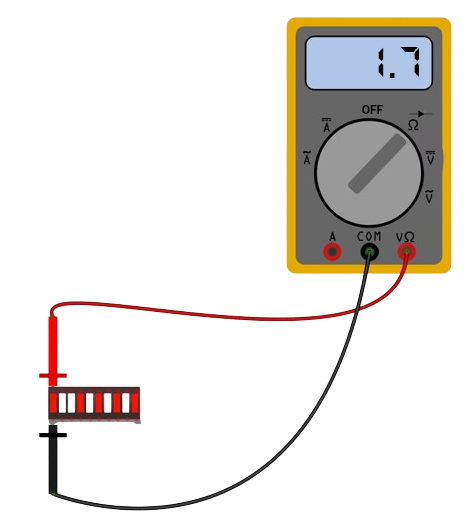
The diode tester on a multimeter will do the job. Place the red lead to one of the pins and the other lead to the adjacent pin. If the meter shows a voltage value of around 1.7 V (for a red LED bar graph), then the pin on the red lead is the anode while the other is the cathode. If the meter shows 0 V, then the pin on the red lead is the cathode while the other is the anode. Remember, all sides of the LED bar graph are anodes or cathodes so you only need to test one pin.
Wiring LED Bar Graph to Arduino
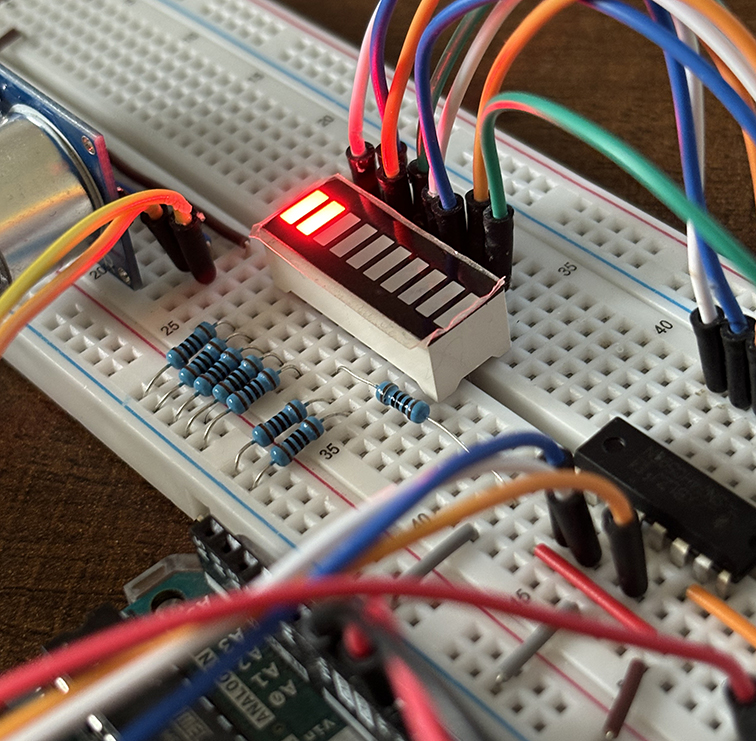
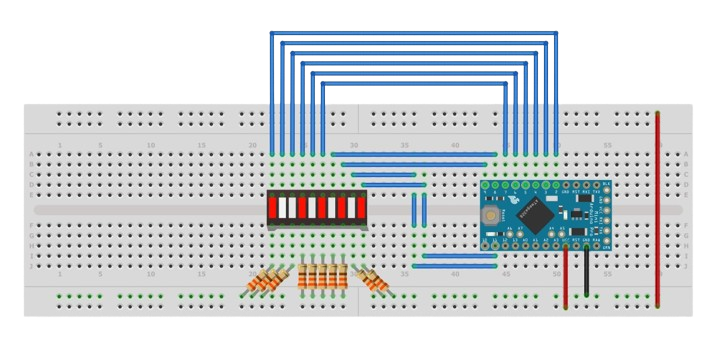
Once you’ve identified the anode and cathode side, you can now wire the LED bar graph to a microcontroller. The anode side is fed by a microcontroller’s pin while the anode side is wired to ground. To protect the LEDs, a 330-ohm resistor is placed between the cathode and ground (or pin and anode, whichever is more convenient). Here is an example wiring diagram using an Arduino:
You can now create a code to control the LED bar graph. Here's a simple one where the LEDs in the graph turn on one by one:
void setup()
{
  for(int i=2;i<12;i++)
  {
    pinMode(i, OUTPUT);
  }
}

void loop()
{
  for(int i=2;i<12;i++)
  {
    digitalWrite(i, HIGH);
    delay(500);
  }

  for(int i=2;i<12;i++)
  {
    digitalWrite(i, LOW);
  }
  delay(500);
}
In the setup() function, we declare each of the Arduino pins we used as OUTPUT pins. I used a for loop here since the pins are in sequence starting from pin 2 to pin 11. Inside the loop(), we have another loop to turn on the LEDs. Each LED turns on for 500 ms then after all of them are on, they turn off using another loop.
Using Shift Register with LED Bar Graph
Another way of controlling an LED bar graph is with the help of a shift register. Shift registers are integrated circuits (ICs) that convert serialized bits into parallel data. The most common shift register IC is the 74HC495. Here is its pinout:
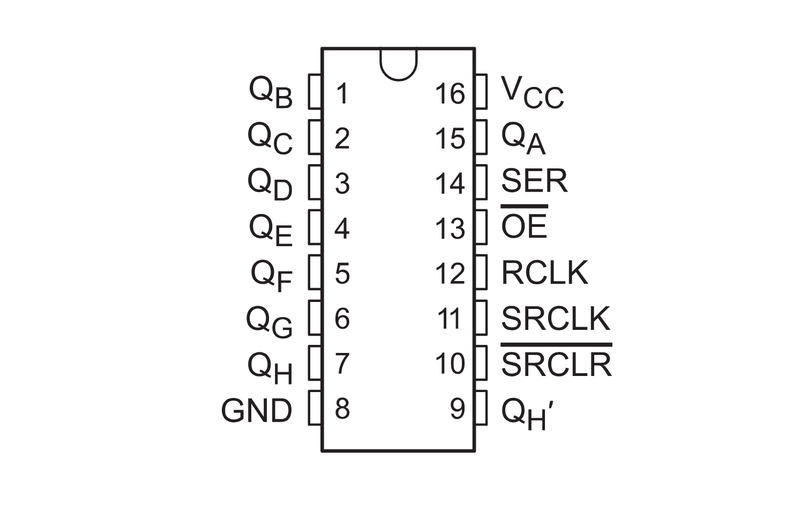
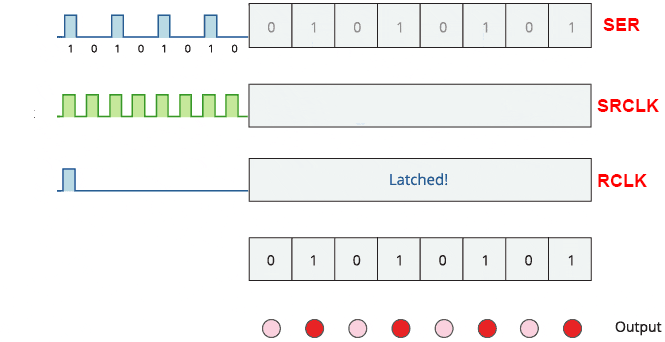
Serial data is fed into the SER (14) pin. Each bit is stored in a register as the SRCLK (11) pin toggles. The output pins QA to QH updates when the RCLK (12) pin or latch receives a pulse.
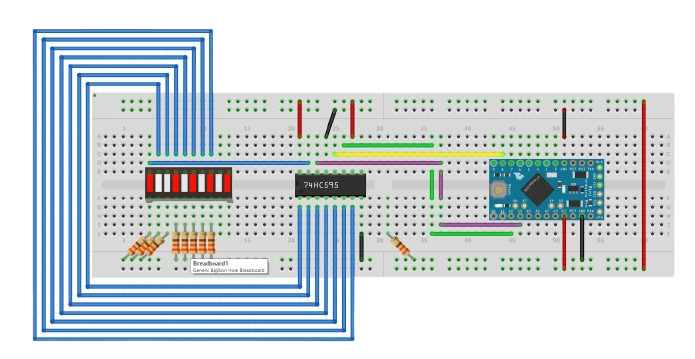
We can connect the 74HC495 to an Arduino to control eight LEDs. The advantage is we will only be using three Arduino pins instead of eight! Here’s a wiring diagram I use:
Here’s the Arduino code, with the same LED behavior as the previous one, but this time, with fewer Arduino pins.
int datapin = 13;
int latchpin = 8;
int clockpin = 12;
boolean dataBytes[10];

void setup() {
  pinMode(datapin,OUTPUT);
  pinMode(latchpin,OUTPUT);
  pinMode(clockpin,OUTPUT);
  writeData();
}

void loop(){

  leftToRight()();
  delay(500);
  rightToLeft()();
  delay(500);
}

void writeData() {
  digitalWrite(latchpin, LOW);
  for (int i = 10; i>=0; i--)
  {
    digitalWrite(clockpin, LOW);
    digitalWrite(datapin, dataBytes[i] );
    digitalWrite(clockpin, HIGH);
  }
  digitalWrite(latchpin, HIGH);
}

void leftToRight() {
  for (int i=0; i<10; i++)
  {
    dataBytes[(i)] = HIGH;
    writeData();
    delay(10);
    dataBytes[(i)] = LOW;
    writeData();
    delay(10);
  }
}

void rightToLeft() {
  for (int i = 10; i>=0; i--)
  {
    dataBytes[(i)] = HIGH;
    delay(10);
    writeData();
    dataBytes[(i)] = LOW;
    delay(10);
    writeData();
  }
}
Later on, I will be creating projects with the use of the LED bar graph. Have fun building!


 Sensor")