
Project Overview
I was recently commissioned to create a simple project for a coffee roasting machine. Basically, I need to measure the temperature of the machine in real time to monitor the progress of the roasting process. This includes a line graph that updates every second and is viewable on a computer. Here’s how I did my arduino temperature sensor project.
Temperature Sensor
The temperature sensor was already decided; a BBQ temperature probe that my client is currently using. This is exactly what it looks like:
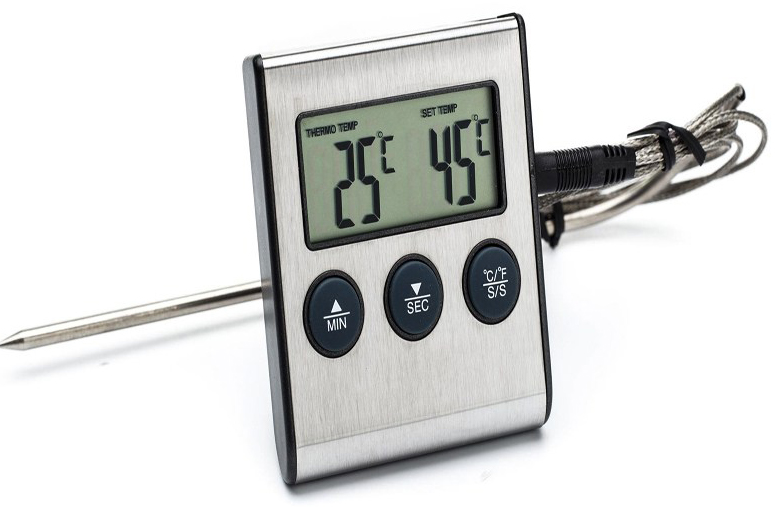
My client made a hole on the roasting machine where the end of the probe is inserted. Then he would record the temperature readings every thirty seconds on a spreadsheet and create a graph based on the records.
After some research I found out that the probe is a thermistor type K. So basically, I just need a way to read the resistance changes of the probe and have it read by an Arduino then send the data to a desktop application for graphing.
Some Thermistor Theory
A thermistor is a resistor that changes its resistance based on temperature. There are two types: NTC and PTC. The NTC type has its resistance decreasing when temperature is increasing. The PTC type behaves the opposite of the NTC type.
I found out that the BBQ temperature probe is an NTC type because the resistance was decreasing when heated.
The resistance of the thermistor can be converted to temperature using the Steinhart-Hart equation:
In the equation, T is the temperature in Kelvins, a, b, and c are known as Steinhart-Hart parameters. This parameters are unique for the device so I started digging them for the temp probe I was using. Thankfully, the probe is a common thermistor type and has these values as parameters:
Read thermistor interfacing tutorial for more information.
Interfacing Circuit
I used a simple voltage divider circuit to convert the resistance into voltage and have that voltage converted to resistance in code.
The voltage to A0 of the Arduino should be:
A temperature rise would result in a resistance decrease which should result in a voltage decrease to A0.
You might have noticed I used a 3.3V from the Arduino as a source and an analog reference. This is because 3.3V is less noisy compared to 5V on the Arduino board. This would make my reading less jittery.
Arduino Sketch
My plan for the Arduino sketch is to take a number of samples, take the average then convert that average to resistance.
for (i=0; i< 100; i++) { //take 100 samples
   samples[i] = analogRead(A0); //read voltage
   delay(10);
}

average = 0;
for (i=0; i< 100; i++) { //take the average of all samples
    average += samples[i];
}
average /= 100;
Then I need to convert that average voltage to resistance:
average = 1023 / average - 1;
average = 10000 / average;
After that, used the steinhart equation to find the temperature:
// get the Kelvin temperature
lnR = Math.log(average); //the ln(R) part in the equation
kelvinTemp = 1 / (0.001129148 + (0.000234125 * lnR) + (0.0000000876741 *
Math.pow(lnR,3));

// convert to Celsius
celsiusTemp = kelvinTemp - 273.15;
Now that I have the temperature value, all that is needed is to transfer that to a PC via the serial port.
Serial.print(celsiusTemp);
PC Program
I used Visual C# (VS 2008) to capture the data from the Arduino via the serial terminal. Then I used MSChart to plot the data. If you are looking to duplicate my desktop app, you need both the MSChart Controls for .NET 3.5 and the MSChart Add-on for Visual Studio.
To capture data, I hooked a function to the DataReceived event of the serial port object:
private void serialPort_DataReceived(object sender, SerialDataReceivedEventArgs e)
{
   RxString = serialPort1.ReadLine();
   RxString = RxString.TrimEnd('\r', '\n');
   temp_cels = Convert.ToString(Convert.ToDouble(RxString)
   this.Invoke(new EventHandler(DisplayTemp));
}

private void DisplayTemp(object sender, EventArgs e)
{
   double f = 1.8 * Convert.ToDouble(temp_cels)+32;
   temp_fahr = Convert.ToString(f);
}
The temp_cels and temp_fahr global variables now have the celsius and fahrenheit temperature readings respectively.
To plot the data, I created two MSChart objects: chartCelsius and chartFahrenheit. I needed to track time as well so I build a string variable time_s that increments in every tick of a Timer object. The string time_s is then converted to a TimeSpan object making it readable by the chart object.
timePlot = Convert.ToString(TimeSpan.Parse(time_s)); //time_s is a string that increments every second

//plotting the data
chartCelsius.Series[0].Points.AddXY(timePlot, Convert.ToDouble(temp_cels));
chartFahrenheit.Series[0].Points.AddXY(timePlot, Convert.ToDouble(temp_fahr));
I also decided to add an LCD to display both Celsius and Fahrenheit temperature readings.
Here’s the video showing the temperature waveforms on the desktop app:
If you are looking to build a similar project, feel free to send me an email!


 Sensor")
