Learning PIC assembly is easier when you can see what happens inside the microcontroller. The problem is that most tutorials show the instruction, the result, and maybe the affected register, but not the path the instruction takes inside the chip. That is what the new PIC16F84A Instruction Trace tool in PICSimulator.com is for.
With this tool, you can enter a PIC assembly instruction such as:
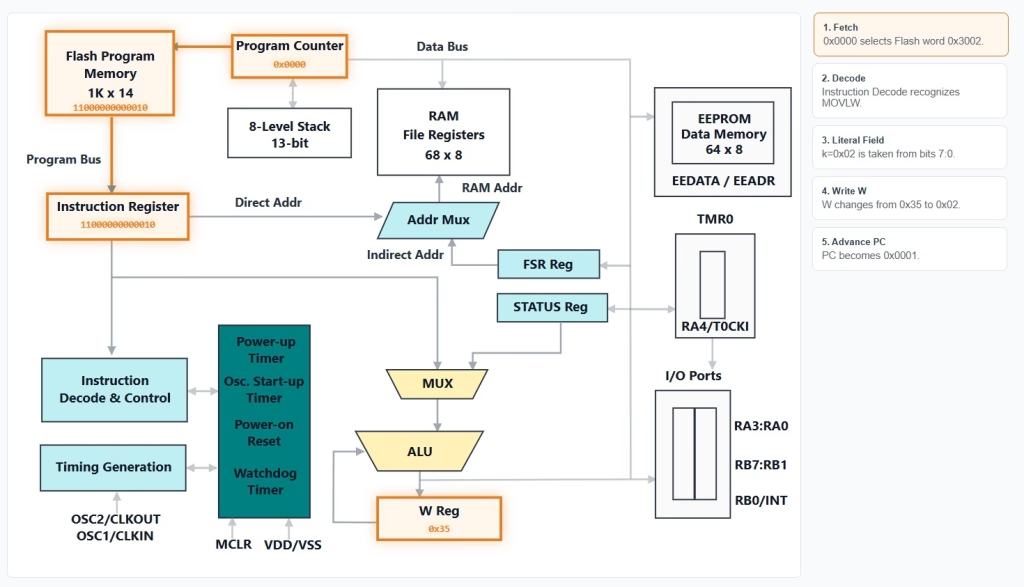
MOVLW 0x02and see how the PIC16F84A fetches the instruction from program memory, places it into the instruction register, decodes the instruction bits, and routes the data through internal blocks such as the W register, RAM file registers, ALU, STATUS register, stack, program counter, and buses.
This is useful especially for beginners who are still trying to understand how PIC assembly instructions actually work.
Contents
- What the Instruction Trace Tool Does
- Why This Is Useful
- Opening the Tool
- Example 1: Tracing MOVLW 0x02
- Example 2: Tracing MOVWF 0x0C
- Example 3: Tracing CLRF 0x0C
- Using the Animate Button
- Understanding the Decoded Word
- Conclusion
What the Instruction Trace Tool Does
The PIC16F84A has only 35 instructions, which is one reason why it is a good microcontroller for beginners. However, each instruction still has its own binary format.
For example, MOVLW 0x02 is not stored inside program memory as text. The PIC does not see the letters M-O-V-L-W. Instead, the assembler converts it into a 14-bit instruction word:
11000000000010The Instruction Trace tool shows this word visually. It also shows which bits represent the instruction opcode and which bits represent the operand.
For MOVLW 0x02, the lower 8 bits contain the literal value:
00000010This is the value that will be loaded into the W register.
Why This Is Useful
When programming in assembly, you are working close to the hardware. A single instruction may affect the W register, file registers, program counter, stack, or STATUS flags.
For beginners, this can be confusing because the effect of an instruction is not always obvious just by reading the code.
The trace tool helps by showing:
- the fetched 14-bit instruction word
- the decoded opcode and operand fields
- the active internal blocks
- the data path used by the instruction
- the final value of W, file registers, STATUS flags, or PC
- the instruction cycle count
- the result of the instruction
Instead of only reading what an instruction does, you can now watch how the PIC processes it internally.
Opening the Tool
Go to:
https://picsimulator.com/instruction-trace.html
You will see an input field for the assembly instruction, state fields for initial register values, the internal PIC16F84A block diagram, and a decoded instruction word section.

To begin, type an instruction into the ASM command field.
Example 1: Tracing MOVLW 0x02
Enter this command:
MOVLW 0x02MOVLW means “move literal to W”. The value 0x02 is the literal value.
The tool shows the instruction word:
11000000000010This is fetched from Flash Program Memory and moved into the Instruction Register.
The instruction is then decoded:
opcode = 110000
k      = 00000010
Here, k is the literal value. Since 00000010 is equal to 0x02, the PIC loads 0x02 into the W register.
After execution:
W = 0x02In the block diagram, you should see the instruction move from program memory to the instruction register, then through the decode/control path, and finally to the W register.
Example 2: Tracing MOVWF 0x0C
Now enter:
MOVWF 0x0CMOVWF means “move W to file register”.
Before running the trace, set the initial W value to something easy to see, for example:
Initial W = 0x35The instruction tells the PIC to copy the contents of W into file register address 0x0C.
After execution:
File register 0x0C = 0x35This is a good instruction for learning how the W register and RAM file registers work together. The W register is not a normal RAM location, but many PIC instructions use it as the main working register.
Example 3: Tracing CLRF 0x0C
Next, enter:
CLRF 0x0CCLRF means “clear file register”.
This instruction writes 0x00 to the selected file register. It also affects the Zero flag in the STATUS register.
After execution:
File register 0x0C = 0x00
STATUS.Z = 1
This is because the result of the operation is zero.
This is one of the important things to remember when writing PIC assembly: some instructions do more than just change a register. They may also affect STATUS flags, which can then affect later conditional instructions.
Using the Animate Button
The tool also includes an Animate button.
Clicking this button steps through the instruction flow automatically. This is useful if you want to follow the operation in order:
- Program Counter points to the instruction address.
- Flash Program Memory outputs the instruction word.
- Instruction Register receives the 14-bit word.
- Decode and Control separates the opcode and operand fields.
- The required internal blocks become active.
- The result is written to W, RAM, STATUS, PC, or another destination.
You can also use the step buttons to move through the trace manually.
Understanding the Decoded Word
At the bottom of the internal block diagram, the tool shows the decoded word.
This section is important because it connects assembly language with machine language.
For example:
MOVLW 0x02becomes:
11000000000010The first bits identify the instruction, while the remaining bits contain the literal value.
For file register instructions such as:
MOVWF 0x0Cthe decoded word contains the file register address. This lets you see where the address bits are located inside the instruction.
For bit-oriented instructions, the decoded word also shows the selected bit number.
Conclusion
The PIC16F84A Instruction Trace tool is designed to make PIC assembly less mysterious. Instead of memorizing instructions only from a table, you can now see how each instruction travels through the internal parts of the microcontroller.
This is especially helpful when learning instructions like MOVLW, MOVWF, CLRF, bit tests, jumps, calls, and instructions that affect the STATUS register.
Try entering different PIC16F84A assembly commands and watch how the internal blocks respond. Once you understand the path of each instruction, writing and debugging PIC assembly becomes much easier.