
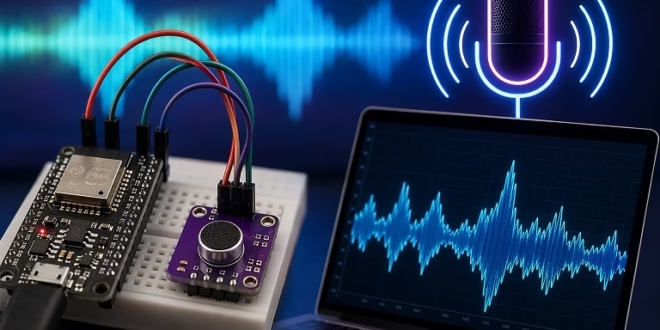
In this project, I’ll show you how I interface the ESP32 with the INMP441 I2S microphone module, starting from basic audio capture and then moving toward a more interactive application where the sound is visualized in real time on a web browser.
When I first worked with microphones on microcontrollers, I used analog modules. They worked, but noise and signal stability were always a concern. The INMP441 solves that by outputting digital audio through I2S. Once I got it working with the ESP32, the readings became much more consistent and reliable.
To make this project more practical, I won’t stop at just reading audio values. I’ll also show how to turn the ESP32 into a web server that displays a live graph of the captured sound—no page refresh needed.
Materials
- ESP32 development board
- INMP441 I2S microphone module
- Jumper wires
- Breadboard
- Wi-Fi network
Understanding the INMP441 and I2S
The INMP441 is a MEMS microphone with a built-in ADC, which means it outputs digital audio instead of an analog voltage. Because of this, the ESP32 uses its I2S peripheral instead of the ADC.
In this setup, the ESP32 acts as the master and generates the clock signals, while the microphone sends audio data back in sync. The key signals involved are the serial clock, word select, and serial data lines.
Although I2S supports stereo, the INMP441 outputs only one channel. The channel depends on the L/R pin connection.
Wiring the ESP32 to INMP441
The connections are simple once you understand the signals. I typically use GPIO26 for the clock, GPIO25 for the word select line, and GPIO33 for the data input.
The L/R pin is connected to ground so the microphone outputs on the left channel. The ESP32 is then configured to read only that channel.
Make sure to power the module using 3.3V. Using 5V can damage it.
Basic Example: Reading Audio Data
Before building anything more advanced, I always start by verifying that the microphone is working correctly. The simplest way to do that is to read the audio samples and print them to the Serial Monitor.
At first glance, the values may look random, but they actually represent the sound waveform.
Example Code
#include "driver/i2s.h"

#define I2S_WS 25
#define I2S_SD 33
#define I2S_SCK 26

#define I2S_PORT I2S_NUM_0
#define BUFFER_LEN 64

int32_t sBuffer[BUFFER_LEN];

void setup() {

 Serial.begin(115200);

 i2s_config_t i2s_config = {
   .mode = (i2s_mode_t)(I2S_MODE_MASTER | I2S_MODE_RX),
   .sample_rate = 16000,
   .bits_per_sample = I2S_BITS_PER_SAMPLE_32BIT,
   .channel_format = I2S_CHANNEL_FMT_ONLY_LEFT,
   .communication_format = I2S_COMM_FORMAT_I2S,
   .intr_alloc_flags = 0,
   .dma_buf_count = 4,
   .dma_buf_len = BUFFER_LEN
 };

 i2s_pin_config_t pin_config = {
   .bck_io_num = I2S_SCK,
   .ws_io_num = I2S_WS,
   .data_out_num = -1,
   .data_in_num = I2S_SD
 };

 i2s_driver_install(I2S_PORT, &i2s_config, 0, NULL);
 i2s_set_pin(I2S_PORT, &pin_config);

}

void loop() {

 size_t bytes_read;

 i2s_read(I2S_PORT, &sBuffer, sizeof(sBuffer), &bytes_read, portMAX_DELAY);

 for (int i = 0; i < BUFFER_LEN; i++) {
   Serial.println(sBuffer[i]);
 }

}
Visualizing the Data (Serial Plotter)
After uploading the code, I usually switch to the Serial Plotter instead of the Serial Monitor. This makes it much easier to understand what’s going on.
When there is silence, the signal appears relatively flat. As soon as I speak or make noise, the waveform starts to move. Louder sounds produce larger peaks.
This step is important because it confirms that both the wiring and I2S configuration are correct before moving on.
From Raw Audio to Usable Data
At this point, we are reading raw audio samples, but sending all of these directly to a web page would not be practical. The ESP32 would have to transmit thousands of samples per second, which is unnecessary for simple visualization.
Instead, I process a block of samples and compute a single value that represents the sound level. This makes the system more efficient while still capturing how loud the environment is.
Turning the ESP32 into a Web Server
Once I confirmed that the microphone works, I moved on to building a web interface.
The ESP32 connects to Wi-Fi and hosts a web page. When I open that page in a browser, it displays a graph that updates continuously based on the microphone input.
To achieve real-time updates, I use Server-Sent Events (SSE). This allows the browser to stay connected to the ESP32 and receive new data automatically, without refreshing the page.
How the Live Graph Works
The ESP32 reads a buffer of samples and computes an average magnitude value. This value represents the sound intensity at that moment.
That value is then streamed to the browser. JavaScript on the page receives the data and draws it on a canvas. As new values arrive, the graph shifts and updates continuously.
The result is a smooth, real-time visualization of sound activity.
Full Example: ESP32 Web Server with Live Sound Graph
#include <WiFi.h>
#include <WebServer.h>
#include "driver/i2s.h"

#define I2S_WS   25
#define I2S_SD   33
#define I2S_SCK  26

#define I2S_PORT       I2S_NUM_0
#define SAMPLE_BUFFER  128

const char* ssid = "YOUR_WIFI_NAME";
const char* password = "YOUR_WIFI_PASSWORD";

WebServer server(80);

int32_t sample_buffer[SAMPLE_BUFFER];

const char webpage[] PROGMEM = R"rawliteral(
<!DOCTYPE html>
<html>
<head>
  <meta name="viewport" content="width=device-width, initial-scale=1">
  <title>ESP32 Sound Graph</title>
  <style>
    body { font-family: Arial; text-align: center; }
    canvas { border: 1px solid black; }
  </style>
</head>
<body>

  <h3>Live Sound Graph</h3>
  <canvas id="graph" width="600" height="250"></canvas>
  <script>

    const canvas = document.getElementById("graph");
    const ctx = canvas.getContext("2d");

    const maxPoints = 120;
    let dataPoints = new Array(maxPoints).fill(0);

    function drawGraph() {
      ctx.clearRect(0, 0, canvas.width, canvas.height);
      ctx.beginPath();

      for (let i = 0; i < dataPoints.length; i++) {
        let x = i * (canvas.width / maxPoints);
        let y = canvas.height - dataPoints[i];
        if (i === 0) ctx.moveTo(x, y);
        else ctx.lineTo(x, y);
      }

      ctx.stroke();
    }

    const source = new EventSource('/events');

    source.onmessage = function(event) {
      let val = parseInt(event.data);
      if (isNaN(val)) return;

      if (val > 250) val = 250;
      if (val < 0) val = 0;

      dataPoints.push(val);
      dataPoints.shift();
      drawGraph();
    };

  </script>

</body>

</html>

)rawliteral";

void setup_i2s() {

  i2s_config_t config = {
    .mode = (i2s_mode_t)(I2S_MODE_MASTER | I2S_MODE_RX),
    .sample_rate = 16000,
    .bits_per_sample = I2S_BITS_PER_SAMPLE_32BIT,
    .channel_format = I2S_CHANNEL_FMT_ONLY_LEFT,
    .communication_format = I2S_COMM_FORMAT_I2S,
    .intr_alloc_flags = 0,
    .dma_buf_count = 4,
    .dma_buf_len = SAMPLE_BUFFER

  };

  i2s_pin_config_t pins = {
    .bck_io_num = I2S_SCK,
    .ws_io_num = I2S_WS,
    .data_out_num = -1,
    .data_in_num = I2S_SD
  };

  i2s_driver_install(I2S_PORT, &config, 0, NULL);
  i2s_set_pin(I2S_PORT, &pins);
}

int get_sound_level() {
  size_t bytes_read;
  i2s_read(I2S_PORT, sample_buffer, sizeof(sample_buffer), &bytes_read, portMAX_DELAY);

  int samples = bytes_read / sizeof(int32_t);
  uint64_t total = 0;

  for (int i = 0; i < samples; i++) {
    int32_t s = sample_buffer[i] >> 14;
    if (s < 0) s = -s;
    total += s;
  }

  int avg = total / samples;
  return map(avg, 0, 3000, 0, 250);

}

void handle_root() {
  server.send_P(200, "text/html", webpage);
}


void handle_events() {

  WiFiClient client = server.client();

  client.println("HTTP/1.1 200 OK");
  client.println("Content-Type: text/event-stream");
  client.println("Cache-Control: no-cache");
  client.println("Connection: keep-alive");
  client.println();


  while (client.connected()) {

    int level = get_sound_level();

    client.print("data: ");

    client.print(level);

    client.print("\n\n");

    delay(50);

  }

}

void setup() {

  Serial.begin(115200);

  setup_i2s();

  WiFi.begin(ssid, password);
  while (WiFi.status() != WL_CONNECTED) {
    delay(500);
  }

  Serial.println(WiFi.localIP());

  server.on("/", handle_root);
  server.on("/events", handle_events);
  server.begin();
}

void loop() {
  server.handleClient();
}
Testing the Web Graph
After uploading the code, I check the Serial Monitor for the ESP32’s IP address. Then I open that address in a browser on the same network.
The graph starts updating immediately. When I speak or clap, the graph responds in real time. If needed, I adjust the scaling in the map() function to better match the environment.
Final Thoughts
I always like starting simple—just reading raw data—before moving into more advanced features. It makes debugging much easier and helps build confidence that each part of the system is working correctly.
Once everything is combined, the ESP32 and INMP441 become a powerful platform for audio-based projects. Adding a live web interface makes it even more practical and interactive.
")

")

")
