
If you are building a smart agriculture project, one of the most useful things you can measure is the nutrient condition of the soil. Moisture sensors can tell you if the soil is wet or dry, but they cannot tell you whether the soil still has enough nutrients for healthy plant growth. This is where an NPK sensor becomes useful.
An NPK sensor measures the levels of Nitrogen (N), Phosphorus (P), and Potassium (K) in soil. These three nutrients are the primary macronutrients needed by plants. In this tutorial, I will show you how to connect an RS485 NPK sensor to an ESP32, read the values using Modbus RTU, and then create a simple web dashboard so you can monitor the readings from your browser without needing to keep the Serial Monitor open.
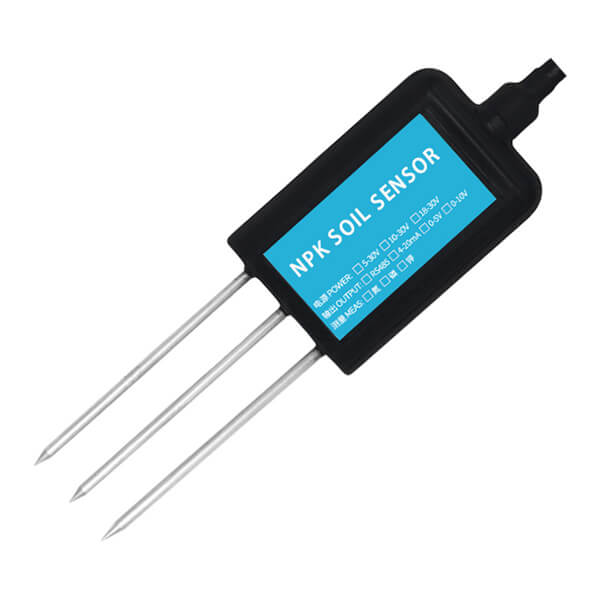
What is an NPK sensor?
An NPK sensor is a soil probe designed to estimate the levels of nitrogen, phosphorus, and potassium present in the soil. These values are commonly reported in mg/kg or in similar concentration-based units depending on the sensor model.
Most low-cost NPK sensors used in hobby and prototype projects do not output simple analog voltages. Instead, they usually communicate using RS485 and Modbus RTU. Because of this, you cannot connect the sensor directly to a normal ESP32 GPIO pin and expect useful readings. The ESP32 needs help from an RS485-to-TTL converter, usually a MAX485 module or something similar.
This sounds more complicated at first, but once the wiring and Modbus request frames are set up correctly, reading the sensor becomes straightforward.
How the sensor communicates
The type of NPK sensor used in this tutorial communicates over RS485, which is commonly used in industrial devices because it works well over longer cable distances and in electrically noisy environments.
The protocol on top of RS485 is usually Modbus RTU. In simple terms, the ESP32 sends a request asking for a specific register, and the sensor replies with the data stored in that register.
For many common NPK sensors, the nutrient registers are as follows:
Nitrogen at register 0x001E
Phosphorus at register 0x001F
Potassium at register 0x0020
The ESP32 must send a proper Modbus frame including the CRC bytes at the end. The sensor then replies with the value.
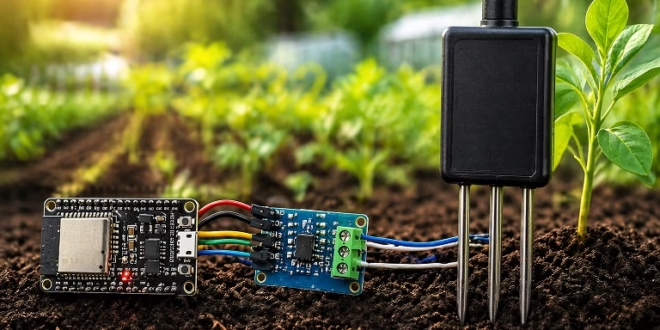
Materials needed
You will need the following parts for this project:
- ESP32 development board
- RS485 NPK soil sensor
- MAX485 or equivalent RS485-to-TTL converter
- Jumper wires
- External power supply for the NPK sensor
- Breadboard or terminal connections as needed
The external power supply is important because many NPK sensors require 9V to 24V, and they will not work correctly from the ESP32’s 3.3V pin.
![]()
Wiring the NPK sensor to the ESP32
The RS485 lines from the sensor connect to the A and B terminals of the MAX485 module. The MAX485 then converts the differential RS485 signals into TTL serial that the ESP32 can understand.
The typical connections are as follows.
NPK sensor to MAX485
- Sensor A to MAX485 A
- Sensor B to MAX485 B
- Sensor VCC to external sensor supply positive
- Sensor GND to external sensor supply ground
MAX485 to ESP32
- RO to ESP32 RX pin
- DI to ESP32 TX pin
- RE and DE tied together, then connected to one ESP32 GPIO
- VCC to ESP32 3.3V or module-rated logic supply
- GND to ESP32 GND
For this tutorial, I will use these ESP32 pins:
- MAX485 RO to GPIO16
- MAX485 DI to GPIO17
- MAX485 RE+DE to GPIO4
The ESP32 and the sensor power supply must share a common ground. Without a common ground, communication may fail or become unstable.
Why the RE/DE pin matters
RS485 communication is usually half-duplex. This means the same pair of wires is used for both sending and receiving data, but not at the same time.
The MAX485 module uses the RE and DE pins to control whether it is transmitting or receiving. In many hobby circuits, these two pins are tied together and driven by one ESP32 GPIO.
When the control pin is HIGH, the module transmits. When it is LOW, the module listens for incoming data. So every time the ESP32 sends a Modbus request, it must briefly switch the MAX485 into transmit mode, then immediately switch back to receive mode so it can catch the sensor’s reply.
Basic ESP32 code to read NPK values
Before jumping into a web dashboard, I always prefer starting with the simplest working version. That means reading the values first and printing them to the Serial Monitor. Once that works, it becomes much easier to build additional features on top.
Here is the basic code:
#include <HardwareSerial.h>

#define RXD2 16
#define TXD2 17
#define RS485_DIR 4

HardwareSerial npk_serial(2);

byte nitrogen_cmd[]   = {0x01, 0x03, 0x00, 0x1E, 0x00, 0x01, 0xE4, 0x0C};
byte phosphorus_cmd[] = {0x01, 0x03, 0x00, 0x1F, 0x00, 0x01, 0xB5, 0xCC};
byte potassium_cmd[]  = {0x01, 0x03, 0x00, 0x20, 0x00, 0x01, 0x85, 0xC0};


void setup() {
  Serial.begin(115200);
  npk_serial.begin(9600, SERIAL_8N1, RXD2, TXD2);
  pinMode(RS485_DIR, OUTPUT);
  digitalWrite(RS485_DIR, LOW);
}

int read_npk_value(byte *command) {
  while (npk_serial.available()) {
    npk_serial.read();
  }

  digitalWrite(RS485_DIR, HIGH);
  delay(10);

  npk_serial.write(command, 8);
  npk_serial.flush();

  digitalWrite(RS485_DIR, LOW);
  delay(20);


  byte response[7];
  int index = 0;
  unsigned long start_time = millis();


  while ((millis() - start_time) < 1000 && index < 7) {
    if (npk_serial.available()) {
      response[index++] = npk_serial.read();
    }
  }


  if (index == 7) {
    return response[4];
  }

   return -1;

}


void loop() {
  int nitrogen = read_npk_value(nitrogen_cmd);
  int phosphorus = read_npk_value(phosphorus_cmd);
  int potassium = read_npk_value(potassium_cmd);


  Serial.print("Nitrogen: ");
  Serial.print(nitrogen);
  Serial.print(" mg/kg, Phosphorus: ");
  Serial.print(phosphorus);
  Serial.print(" mg/kg, Potassium: ");
  Serial.print(potassium);
  Serial.println(" mg/kg");

  delay(2000);
}
Understanding the code
The ESP32 is using HardwareSerial(2) so that we can use a second UART for the sensor. That keeps the main Serial Monitor free for debugging.
Each nutrient has its own Modbus command frame. These command frames already include the sensor address, function code, register address, number of registers to read, and CRC bytes.
The read_npk_value() function performs four important steps:
First, it clears any old bytes from the UART buffer. This prevents leftover data from earlier reads from corrupting the next reading.
Second, it sets the RS485 direction pin HIGH so the MAX485 goes into transmit mode.
Third, it writes the Modbus command to the sensor.
Fourth, it switches the RS485 module back to receive mode and waits for the reply.
If the sensor responds correctly, the function returns the value byte. If not, it returns -1, which is useful for indicating a failed read.
Expected Serial Monitor output
If everything is wired correctly, you should see values similar to this:
Nitrogen: 32 mg/kg, Phosphorus: 14 mg/kg, Potassium: 56 mg/kg
Nitrogen: 31 mg/kg, Phosphorus: 14 mg/kg, Potassium: 57 mg/kg
Nitrogen: 32 mg/kg, Phosphorus: 15 mg/kg, Potassium: 56 mg/kg
The numbers will vary depending on your soil and sensor model. Some cheaper sensors may not be highly accurate, but they are still useful for monitoring trends and comparing one soil condition against another.
Looking at the Modbus response
A typical sensor reply might look something like this:
01 03 02 00 20 B8 44
This can be interpreted as follows:
- 01 is the sensor address
- 03 is the Modbus function code for reading holding registers
- 02 means two data bytes follow
- 00 20 is the returned value in hexadecimal
- B8 44 is the CRC
Hex 0x0020 is decimal 32, so that would mean the nutrient value is 32.
In the basic example above, I kept things simple and returned response[4], since many sensors return small values that fit in one byte. However, if your sensor returns larger values, you may need to combine both data bytes like this:
int value = (response[3] << 8) | response[4];
That is the safer approach if you expect readings greater than 255.
Adding a web dashboard
Once I can see valid readings in the Serial Monitor, the next step is making the ESP32 serve those values on a web page. This way, I can open the ESP32 IP address in a browser on my phone or laptop and watch the nutrient values update automatically.
To keep things simple, I will use the built-in WiFi.h and WebServer.h libraries. The browser will periodically request the latest readings from a /data endpoint, and JavaScript on the page will update the displayed values automatically.
This approach is simple, reliable, and easy to understand.
How the web dashboard works
The idea is straightforward:
The ESP32 connects to Wi-Fi and starts a web server. The main page contains some HTML and JavaScript. Every two seconds, the JavaScript sends a request to /data. The ESP32 responds with the latest NPK values in JSON format. The browser then updates the page without needing a manual refresh.
So while the sensor continues to be read by the ESP32, the browser becomes a live dashboard.
ESP32 NPK web dashboard code
#include <WiFi.h>
#include <WebServer.h>
#include <HardwareSerial.h>

#define RXD2 16
#define TXD2 17
#define RS485_DIR 4

const char* ssid = "YOUR_WIFI_NAME";
const char* password = "YOUR_WIFI_PASSWORD";

HardwareSerial npk_serial(2);
WebServer server(80);

byte nitrogen_cmd[]   = {0x01, 0x03, 0x00, 0x1E, 0x00, 0x01, 0xE4, 0x0C};
byte phosphorus_cmd[] = {0x01, 0x03, 0x00, 0x1F, 0x00, 0x01, 0xB5, 0xCC};
byte potassium_cmd[]  = {0x01, 0x03, 0x00, 0x20, 0x00, 0x01, 0x85, 0xC0};

int nitrogen_value = -1;
int phosphorus_value = -1;
int potassium_value = -1;

unsigned long last_read_time = 0;
const unsigned long read_interval = 2000;

const char dashboard_html[] PROGMEM = R"rawliteral(
<!DOCTYPE html>
<html>
<head>
  <meta name="viewport" content="width=device-width, initial-scale=1">
  <title>NPK Sensor Dashboard</title>
  <style>
    body {
      font-family: Arial, sans-serif;
      text-align: center;
      margin: 0;
      padding: 20px;
      background: #f4f4f4;
    }
    .container {
      max-width: 500px;
      margin: auto;
    }
    .card {
      background: white;
      margin: 15px 0;
      padding: 20px;
      border-radius: 12px;
      box-shadow: 0 2px 8px rgba(0,0,0,0.1);
    }
    .label {
      font-size: 18px;
      color: #555;
    }
    .value {
      font-size: 36px;
      font-weight: bold;
      margin-top: 10px;
    }
    .unit {
      font-size: 16px;
      color: #777;
    }
    .status {
      margin-top: 20px;
      color: #666;
      font-size: 14px;
    }
  </style>
</head>
<body>
  <div class="container">
    <h2>NPK Soil Sensor Dashboard</h2>
    <div class="card">
      <div class="label">Nitrogen</div>
      <div class="value" id="nitrogen">--</div>
      <div class="unit">mg/kg</div>
    </div>
    <div class="card">
      <div class="label">Phosphorus</div>
      <div class="value" id="phosphorus">--</div>
      <div class="unit">mg/kg</div>
    </div>
    <div class="card">
      <div class="label">Potassium</div>
      <div class="value" id="potassium">--</div>
      <div class="unit">mg/kg</div>
    </div>
    <div class="status" id="status">Waiting for data...</div>
  </div>
  <script>
    function updateData() {
      fetch('/data')
        .then(response => response.json())
        .then(data => {
          document.getElementById('nitrogen').innerText = data.nitrogen;
          document.getElementById('phosphorus').innerText = data.phosphorus;
          document.getElementById('potassium').innerText = data.potassium;
          document.getElementById('status').innerText =
            'Last updated: ' + new Date().toLocaleTimeString();
        })
        .catch(error => {
          document.getElementById('status').innerText = 'Connection error';
        });
    }
    updateData();
    setInterval(updateData, 2000);
  </script>
</body>
</html>
)rawliteral";


int read_npk_value(byte *command) {
  while (npk_serial.available()) {
    npk_serial.read();
  }

  digitalWrite(RS485_DIR, HIGH);
  delay(10);

  npk_serial.write(command, 8);
  npk_serial.flush();

  digitalWrite(RS485_DIR, LOW);
  delay(20);

  byte response[7];
  int index = 0;
  unsigned long start_time = millis();

  while ((millis() - start_time) < 1000 && index < 7) {
    if (npk_serial.available()) {
      response[index++] = npk_serial.read();
    }
  }

  if (index == 7) {
    return (response[3] << 8) | response[4];
  }

  return -1;
}

void update_sensor_values() {
  nitrogen_value = read_npk_value(nitrogen_cmd);
  delay(100);

  phosphorus_value = read_npk_value(phosphorus_cmd);
  delay(100);

  potassium_value = read_npk_value(potassium_cmd);
}

void handle_root() {
  server.send(200, "text/html", dashboard_html);
}

void handle_data() {
  String json = "{";
  json += "\"nitrogen\":" + String(nitrogen_value) + ",";
  json += "\"phosphorus\":" + String(phosphorus_value) + ",";
  json += "\"potassium\":" + String(potassium_value);
  json += "}";
  server.send(200, "application/json", json);
}

void setup() {
  Serial.begin(115200);
  npk_serial.begin(9600, SERIAL_8N1, RXD2, TXD2);
  pinMode(RS485_DIR, OUTPUT);
  digitalWrite(RS485_DIR, LOW);
  WiFi.begin(ssid, password);
  Serial.print("Connecting to WiFi");

  while (WiFi.status() != WL_CONNECTED) {
    delay(500);
    Serial.print(".");
  }

  Serial.println();
  Serial.print("Connected. ESP32 IP address: ");
  Serial.println(WiFi.localIP());

  update_sensor_values();

  server.on("/", handle_root);
  server.on("/data", handle_data);
  server.begin();

  Serial.println("Web server started");
}

void loop() {
  server.handleClient();

  if (millis() - last_read_time >= read_interval) {
    last_read_time = millis();
    update_sensor_values();

    Serial.print("N: ");
    Serial.print(nitrogen_value);
    Serial.print("  P: ");
    Serial.print(phosphorus_value);
    Serial.print("  K: ");
    Serial.println(potassium_value);
  }
}
What this code adds
This version builds on the earlier example. It still reads the sensor the same way, but now it also does three additional things.
First, it connects the ESP32 to your Wi-Fi network.
Second, it starts a web server and serves a dashboard page when you visit the ESP32 IP address.
Third, it creates a /data endpoint that sends the current nitrogen, phosphorus, and potassium readings in JSON format.
The JavaScript in the browser requests this JSON every two seconds, so the dashboard updates automatically.
Viewing the dashboard
After uploading the code, open the Serial Monitor. Once the ESP32 connects to Wi-Fi, it will print something like this:
Connected. ESP32 IP address: 192.168.1.25
Web server started
Open that IP address in your browser. You should see a simple dashboard showing the current nitrogen, phosphorus, and potassium values.
As the ESP32 reads new values, the page updates automatically every two seconds. There is no need to refresh the browser manually.
Why this approach is useful
A web dashboard makes the project much more practical. Instead of connecting the ESP32 to a computer and opening the Serial Monitor every time, you can simply use your phone or laptop on the same Wi-Fi network.
This is useful for greenhouse monitoring, classroom demonstrations, farm prototypes, and remote sensor nodes where you want a quick way to view live data.
Once this basic dashboard is working, you can later expand it into something more advanced such as charts, historical logging, cloud upload, or mobile notifications.
Common problems and fixes
One of the most common issues is getting -1 values from the sensor. This usually means the ESP32 did not receive a valid response. If this happens, I would first check the A and B lines on the RS485 connection. Some sensors label these differently, so swapping them is often worth trying.
Another common issue is power. Many NPK sensors draw more power than expected and require a stable external supply. If the supply is weak or noisy, the readings may fail or jump around.
If the web page loads but the values do not update, check whether the ESP32 is still reading the sensor properly in the Serial Monitor. If the Serial Monitor values are wrong, the browser will simply display those same wrong values.
If the browser cannot load the dashboard at all, verify that your phone or laptop is on the same Wi-Fi network as the ESP32.
Possible improvements
This version is intentionally simple so it is easy to follow. But once you understand the flow, there are several ways to improve it.
You could add color indicators so the dashboard visually shows low, medium, or high nutrient levels. You could also add a chart so you can see how values change over time. Another useful upgrade would be to save the readings into EEPROM, SPIFFS, an SD card, or a cloud database.
If you want smoother real-time updates, you can also replace periodic fetch() requests with WebSockets, but for many projects the current method is already enough.
Final thoughts
Using an NPK sensor with an ESP32 is a very good beginner-to-intermediate project because it introduces several useful topics at once. You learn how to work with RS485, how Modbus RTU communication works, how to read industrial-style sensors, and how to turn the ESP32 into a live monitoring device with a browser-based dashboard.
I like this kind of project because it moves beyond simple LEDs and basic analog sensors. It feels much closer to how real agricultural and industrial monitoring systems are built.
The most important thing is to get the basic serial-reading version working first. Once you can reliably read nitrogen, phosphorus, and potassium values, adding the web dashboard becomes much easier.


")